- Description
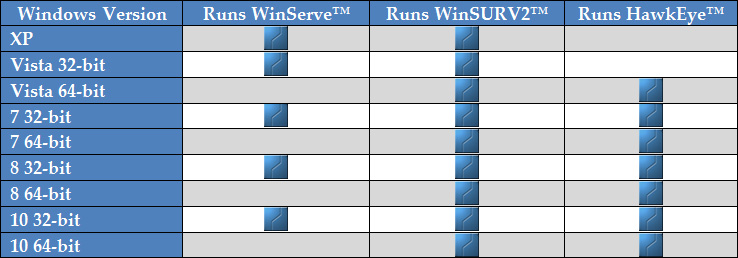
Note: HawkEye comes with WinSurv2™, the Daily-BHA reporting program.
- 3D visualization of dozens of objects
- Center-to-center scans in 3D and in the reports
- Separation factor in 3D and in the reports
Click below to expand details on features:
Notice: Undefined variable: html in /home/mchardism/public_html/modules/mod_fancyacc/helper.php on line 196
Strict Standards: Only variables should be assigned by reference in /home/mchardism/public_html/modules/mod_fancyacc/tmpl/default.php on line 28
3D Visualization
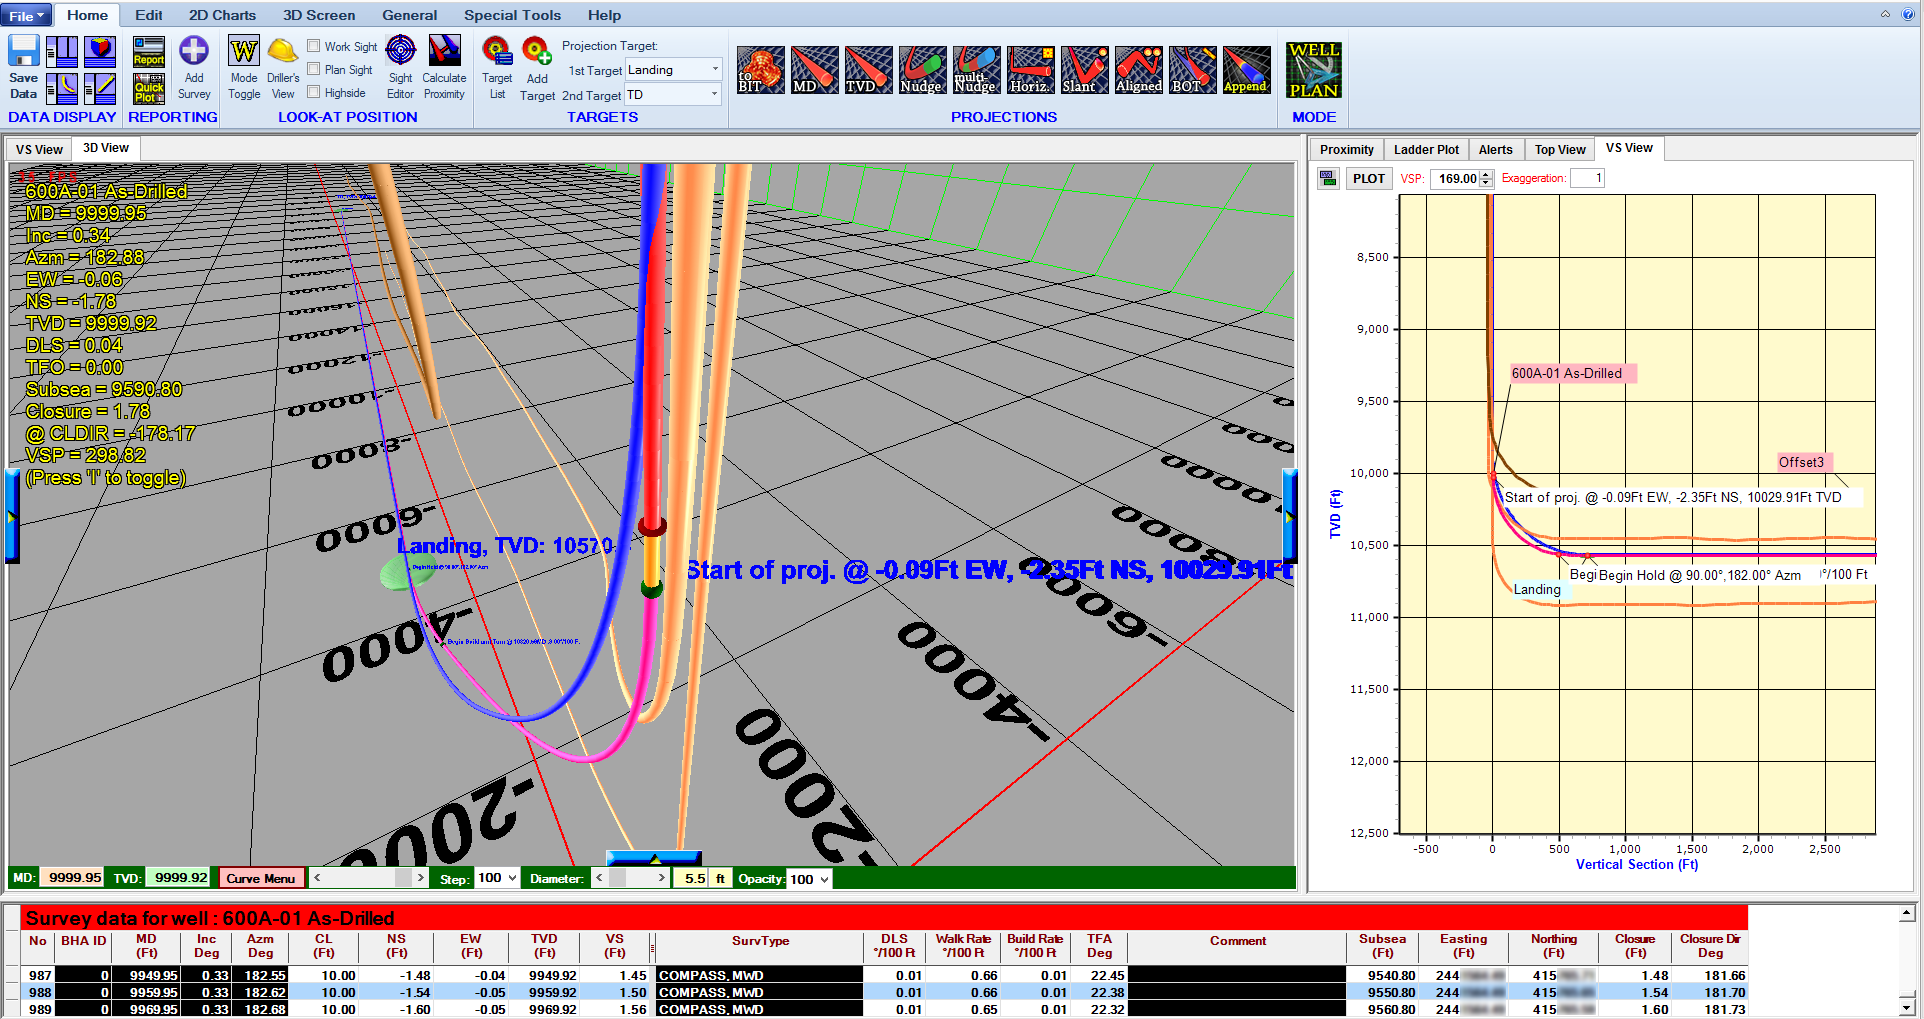
The 3D space allows for comprehensive well tracking and visualization from any angle.
This fluid space contains not only offset wells, plans and projections, but also customizable targets, planes, lithologies and casing indicators. Working in conjunction with the 2D views and the project data tree, as well as the survey list, the 3D space is what makes HawkEye™ far and away the easiest and most powerful tool for well planning and monitoring.

HawkEye™ allows the user to customize the appearance of everything in the 3D space in an easy way.
Everything in the 3D space is customizable. The controls allow the user to make the appearance of the 3D space their own, both for personal preference, company-wide standardization or client-based parameters.
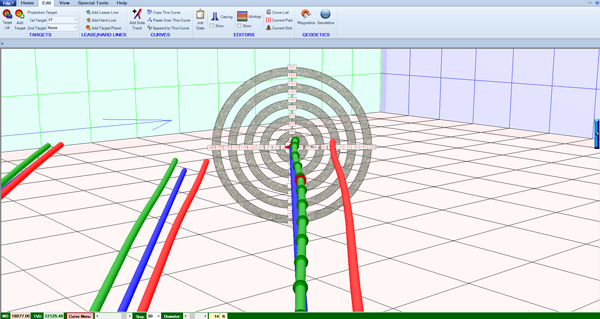
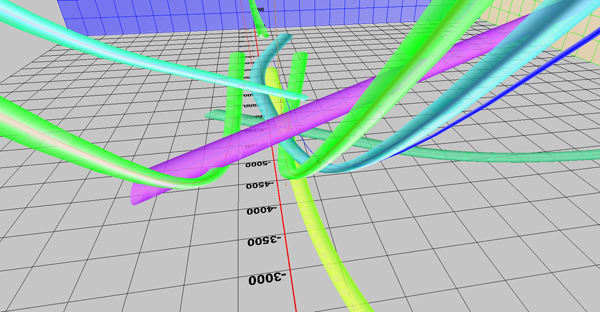
Below is an illustration of how a drilled curve can be compared against the plan and other offsets. Thickness of the curves can be exaggerated for visual purposes:
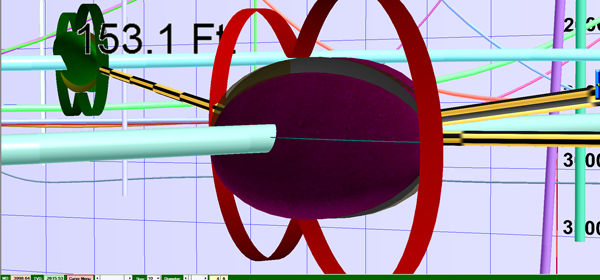
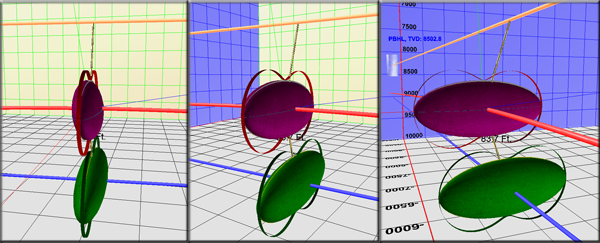
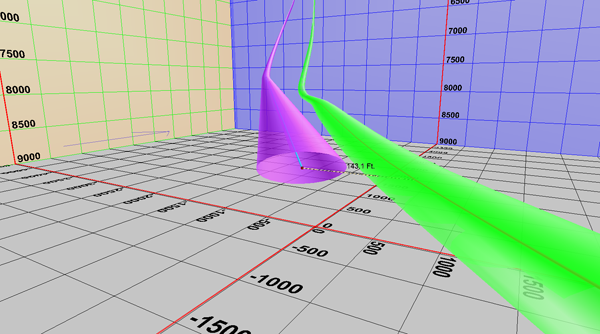
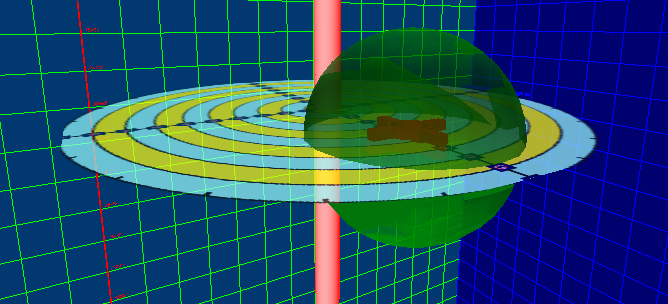
Below is an example of an ellipsoid of uncertainty on the reference curve and on the closest compare curve. The black and yellow lines are lines of closest approach. The red curves are the pedal curves, the actual outer mathematical boundary upon which industry standard separation factor is calculated:
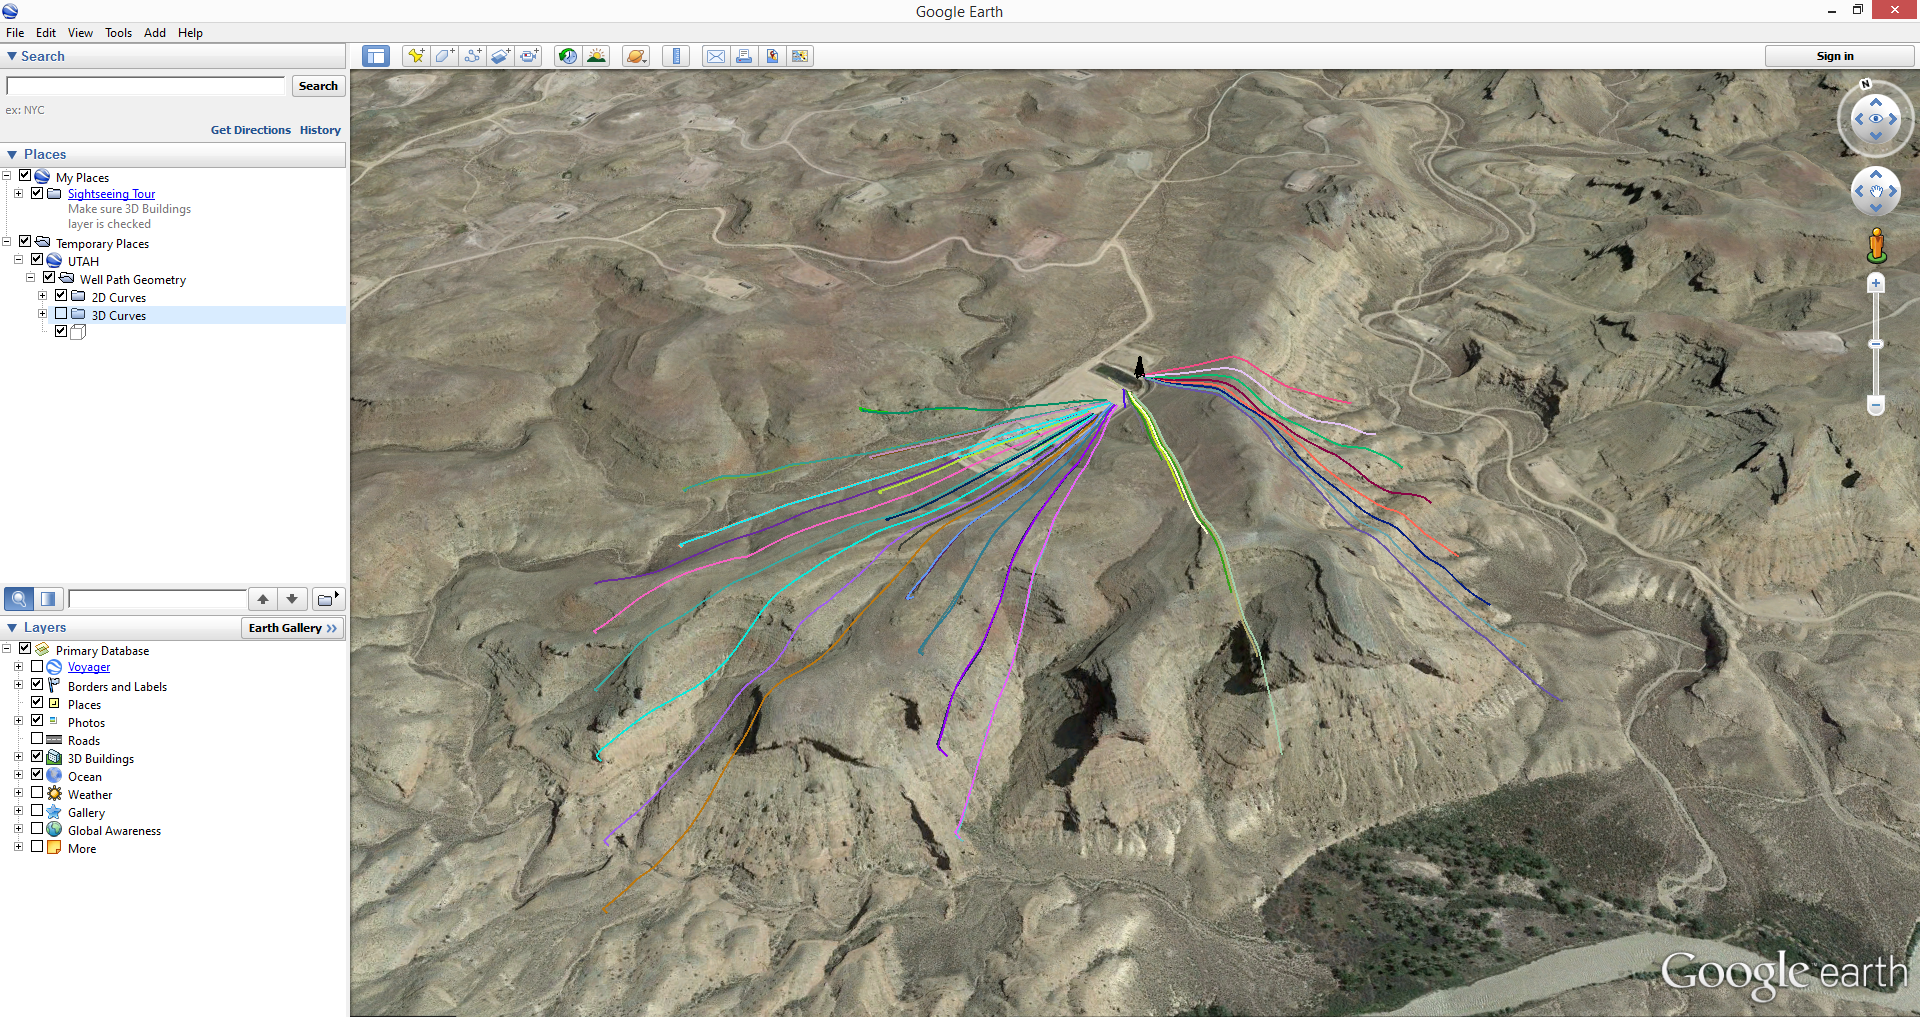
Google Earth
HawkEyeTM can superimpose the 3D curves of a project onto a Google Earth satellite image of the planet's surface.
The Google Earth program superimposes over a satellite image of the planet’s surface all plans, offsets and hardline/leaselines. The project information that is displayed on the surface map appears to sit aboveground.
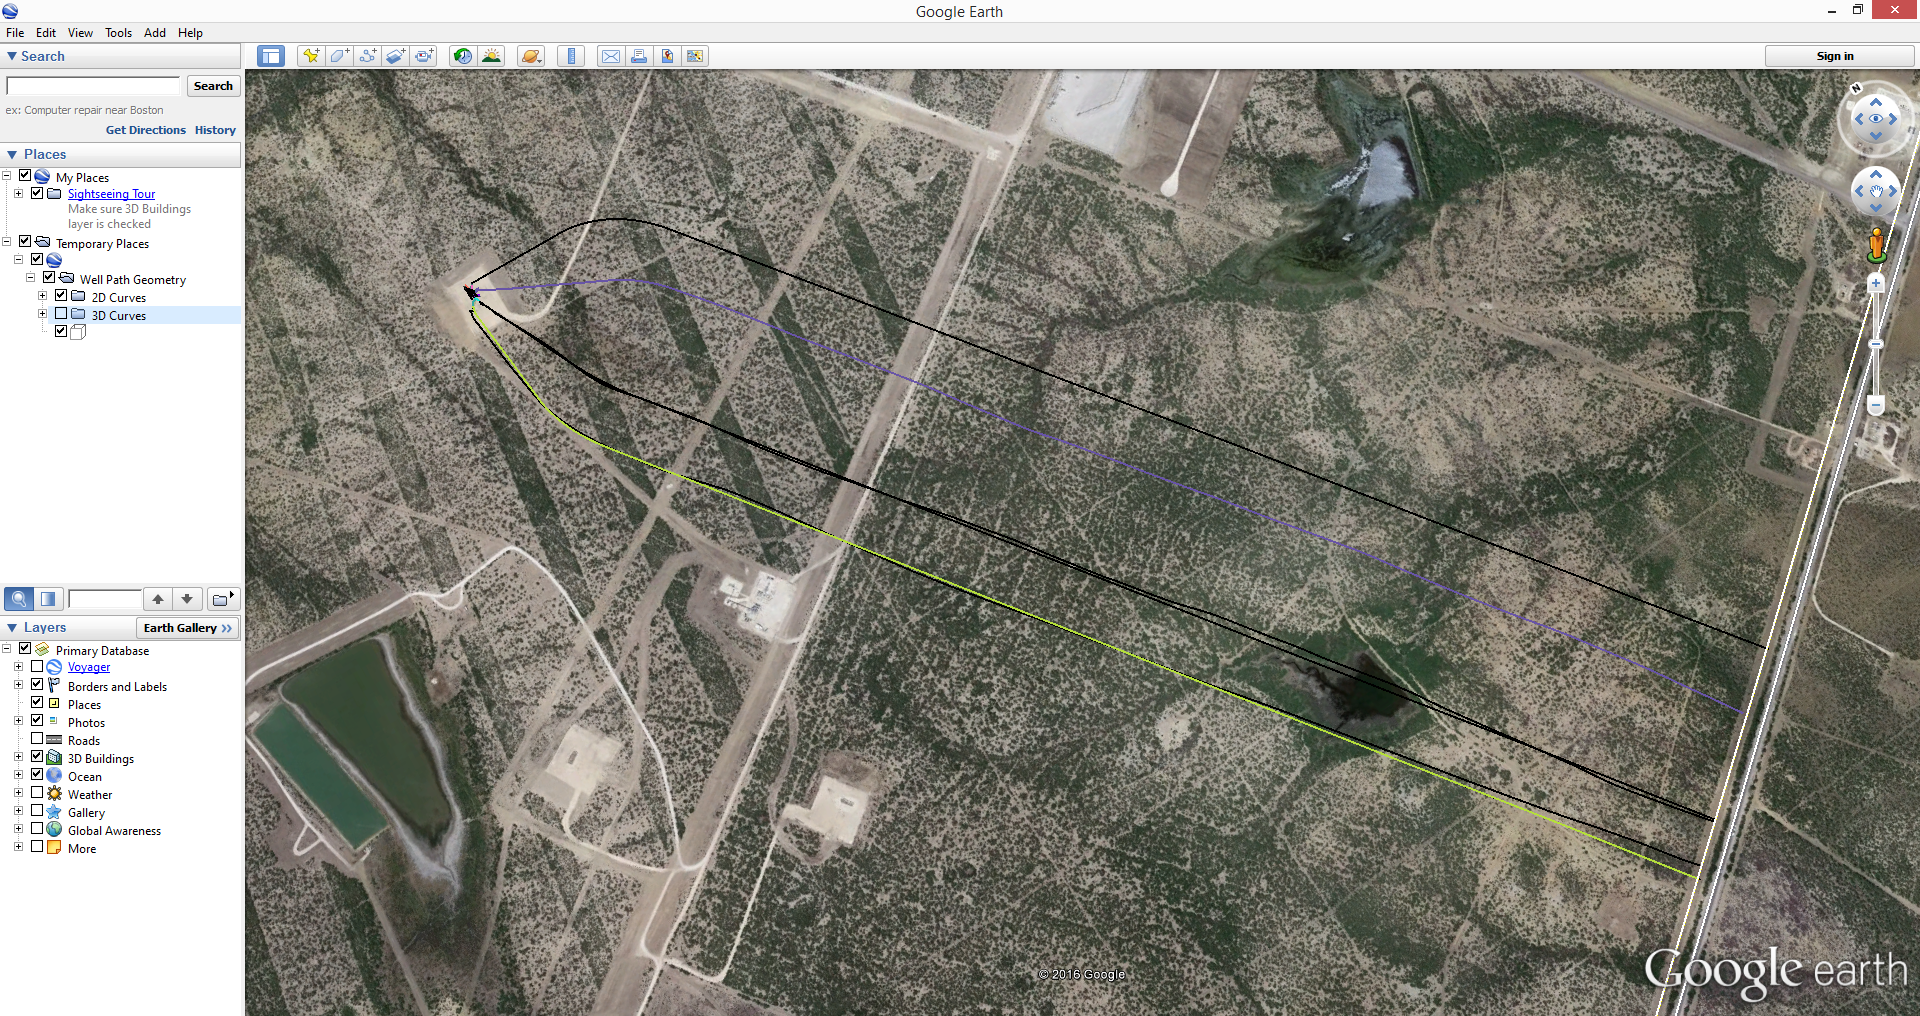
- With only 3D Curves toggled on, the well will be displayed as ending at the surface of the planet and extending upwards to the sky with a 1:1 scale.
- With both 3D and 2D Curves on, a path along the surface will illustrate where the curve walks along the surface as well as the 3D curve going upward.
- The Google Earth module requires that Google Earth be installed. It will also require a live internet connection to run. Download for free at http://earth.google.com.
Daily Items and BHA
HawkEye™ comes with an integrated reporting package for the independent directional driller or directional drilling companies. Based on the legacy WinSURV2™ package, this integrated module comes as part of HawkEye™ license purchased.
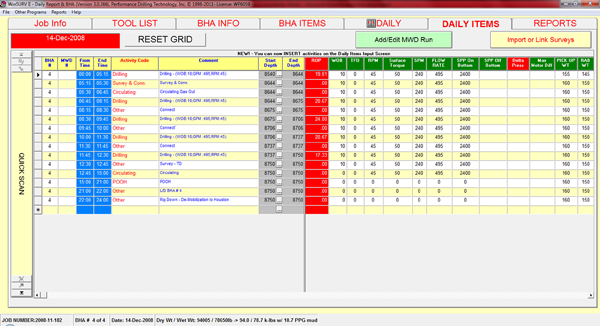
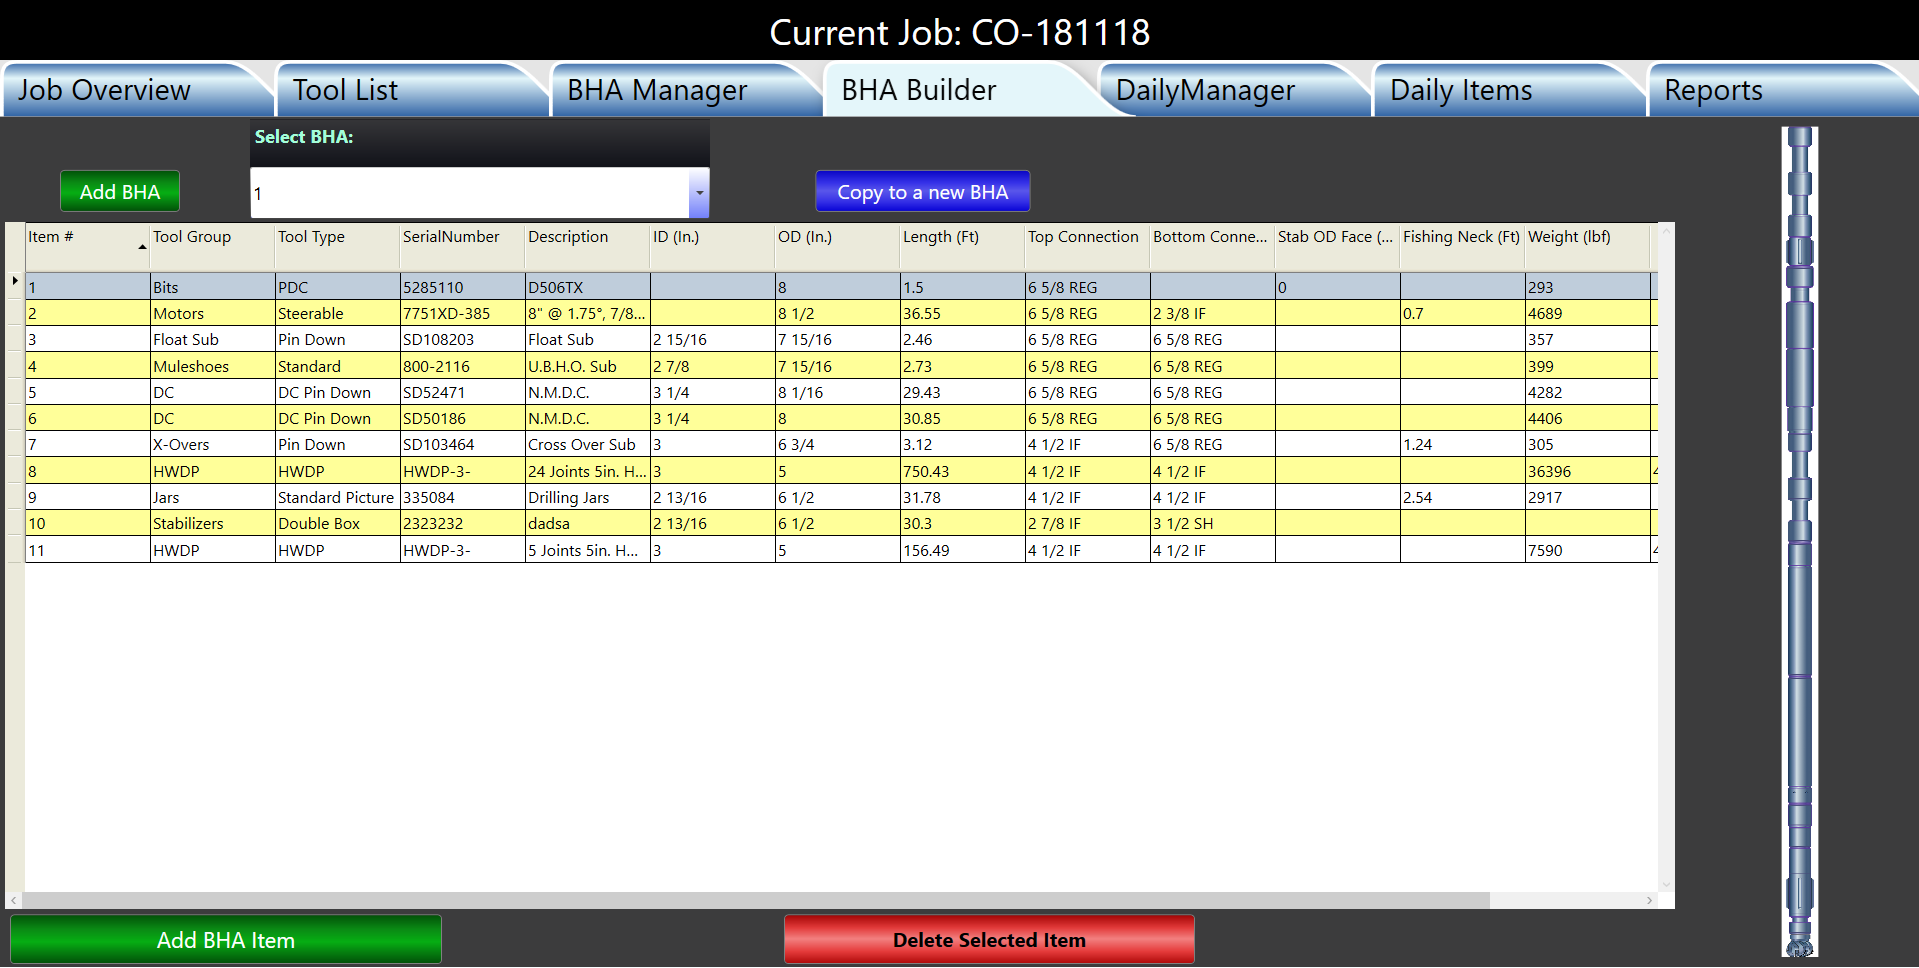
This module feeds the HawkEye database with all the BHAs and daily activity reports.
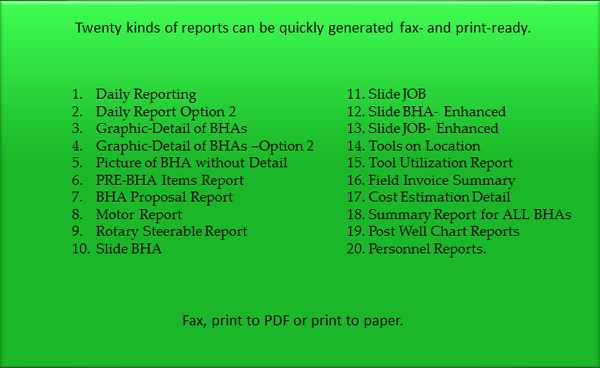
Report Types
Data Organization
![]() Data Organization
Data Organization
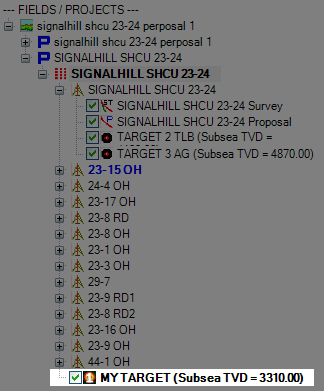
All data for each Field/Project is saved to a single database file. The data is organized and presented in a tree hierarchy.
DATA TREE: The Data Tree is the basis for navigating through all the immense information that a project contains in HawkEye™. It is intuitively organized to allow the user the easiest method of random access to project information. As illustrated below, a target can easily be found and categorized from a large project or series of projects just by virtue of the heirarchy.
Easy Importing
Bringing in curve and project data from a spreadsheet, text file, WinServe or Compass is made extremely simple, either by drag-and-drop, copy-paste or using the file menu in HawkEye.
- Survey Lists: Copy survey lists or just a list of critical points from spreadsheets or .CSV files and paste them directly into HawkEye.
- Curve Files: Either drag-and-drop or copy-paste WinSERVE (.SAY) or Compass text files into HawkEye without even having to open the file.
- Project Files: Project files from WinServe (.SVY) and Compass (EDM.XML) can be dragged and dropped right into the HawkEye screen, where they are automatically parsed out into project information in the open HawkEye database.
Uncertainty and Separation Factor in 3D
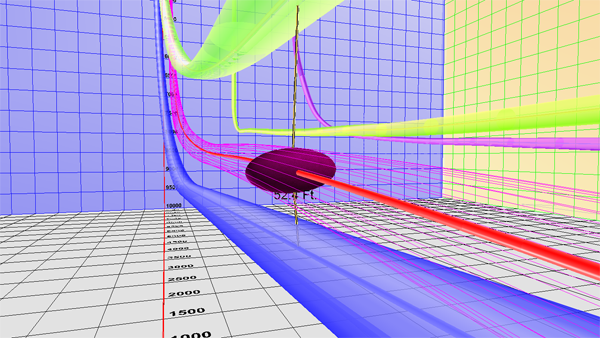
Software that uses a pedal curve method of calculation never visualize that pedal curve in a 3D space. Because HawkEye™ does so, along with the underlying ellipse, it becomes easier than ever to visually understand areas of uncertainty associated with a well at any depth.
Ellipsoidal Cylinders
Error modelling is based on models submitted by the International Steering Committee on Wellbore Survey Accuracy (ISCWSA). The organization is dedicated to providing a consistent set of reliable data on survey-tool performance in today's wells. Their work is fully incorporated into Hawkeye and the user benefits from it.
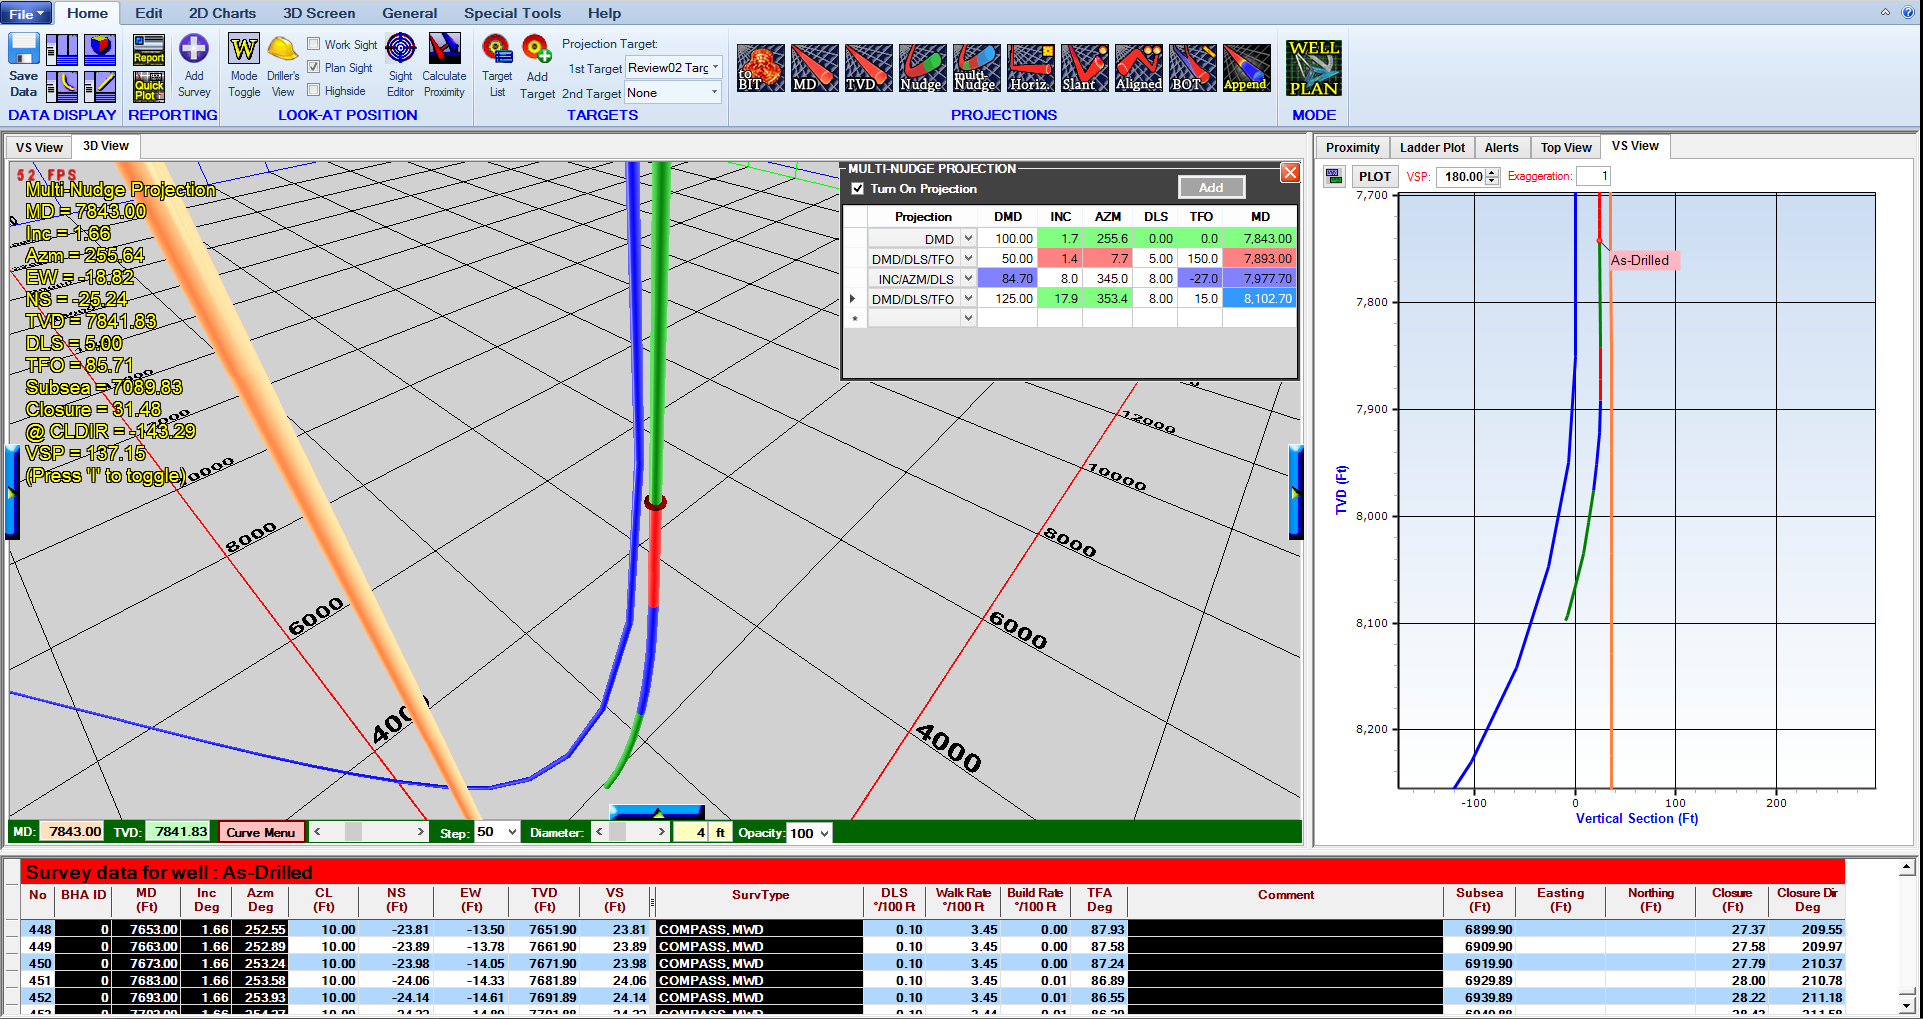
Projections
The user has at their disposal a series of nine types of projections which can be generated quickly.
The projections can be sub-divided into two general categories: targetless and targeted projections.
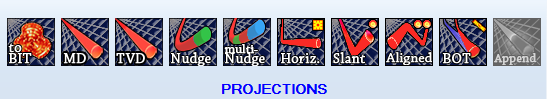
TARGETLESS PROJECTIONS
- Sensor-to-Bit- Allows a projection to be strung to a bit from where your surveyed position is. From there you can append other kinds of projections to the end.
- MD & TVD- Hold a particular inclination and azimuth and goes in a straight path for the defined distance.
- Nudge- Mimics minimum curvature calculations but allows for the nudging of a variety of different user-defined parameters.
- Multi-Nudge- Designed for rotary steerable systems and calculates an unlimited number of Nudge projections end to end.
TARGETED PROJECTIONS
- Horizontal- Will project to a horizontal plane, which is considered a 2D target. Horizontal plane is defined by an RKBTVD, a max dip angle and a max dip direction.
- Slant a.k.a. DLS, Build-and-Hold- Can solve for a hold angle by providing a dogleg severity or solve for dogleg severity by providing a hold angle.
- Aligned- Set two dogleg severities, as well as desired inclination and azimuth at target.
- Back-on-Track (BOT)- Set two dogleg severities and a minimum distance in order to intersect your proposal.
Projection Tools
There are a number of powerful non-projection tools found in the 3D space of HawkEye™, many of which are exclusive to having a workable 3D space.
THE SIGHT
The Sight is an integral part of the 3D view in HawkEye™, a visual aid that follows the user’s point of view or “Look-at Point” along a curve. It is customizable and can be toggled on and off.
APPEND TO CURVE
HawkEye™ allows the user to append a projection to the end of any curve. This will be needed frequently for any user who needs to make a projection with any amount of complication. Fortunately, the process is intuitive and simple. The appended curve does not need to be added to the very end of a curve, and can be tied in at any point.
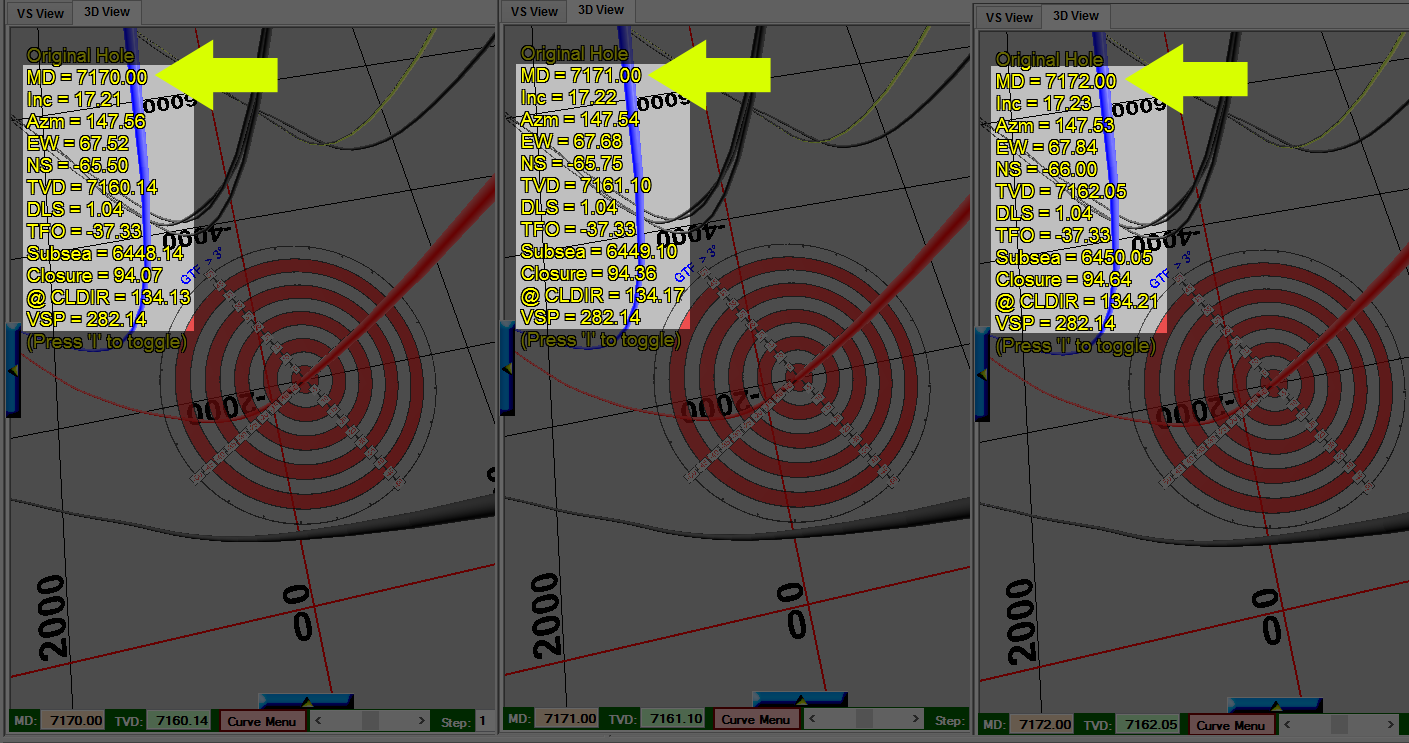
INTERPOLATION
Interpolation is a method of constructing new data points within the range of a discrete set of known data points. In HawkEye™, the Interpolation tool allows the user to either merely CALL FOR A SURVEY ENTRY into a list, or to go ahead and use an interpolation point as a TIE-IN POINT for a sidetrack curve. Once inside the panel, there are two major choices: 1) to invoke either an MD or a TVD interpolation, and 2) whether to merely have that interpolation point or to use the point as a tie-in for a sidetrack curve.
The most notable aspect of interpolation in HawkEye is that the program is constantly interpolating in the 3D space. So when you travel up and down a well or planned well, any point that you're on is interpolated in a tiny fraction of a second, even if there was no survey station there.
Reports
Report generation is a staple function, but the flexibility and customizability in Hawkeye has made reports a notable feature in its own right.
Hawkeye can produce six different kinds of reports: survey, critical points, projection only, interpolated survey, criticality, and anti-collision reports. The user can use templates, or design personal templates by combining and re-ordering any of over 40 data columns, ready to print, email or export to PDF, CSV or Excel.

Reports in HawkEye™:
- Survey Reports- This is the default type of report, which presents all of a curve’s surveys under critical points headings.
- Projection Reports- This will show all svys from an active projection, and can be included as part of a the standard report.
- Interpolated Reports- This report is useful for interpolating surveys across different types of wells. It has different interval options between a proposal and an as-drilled well.
- Critical Points Reports- This report displays only the geometrically defined critical points and user comments for a curve.
- Criticality Reports- A special kind of least distance report where several different wells can be compared to determine dangerous proximities.
- Anti-Colision Reports- These comprehensive readouts include all values related to separation factor and include a ladder plot as cover page.
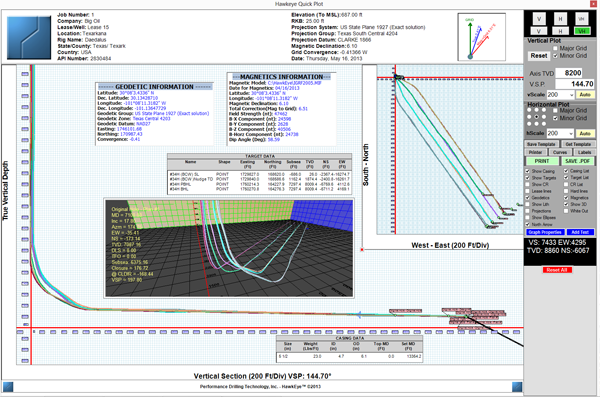
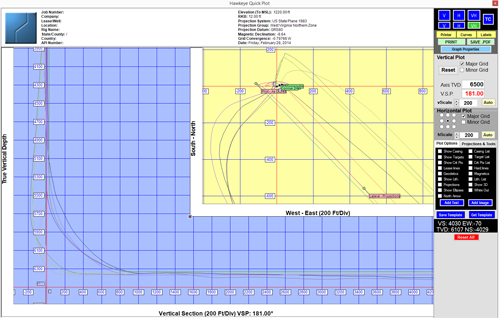
QuickPlots™
The QuickPlot module is a direct, easy and fast way to create plots. The most prominent feature is the ability to add a 3D snapshot anywhere in the plot itself.
This interface uses the What-You-See-Is-What-You-Get interface, which makes it easy to drop in any number of elements and get on paper exactly what you see on the screen.Labeling and all colors are fully customizable.
The following elements can be added to a QuickPlot:
- Vertical Section view graph and/or Horizontal view graph
- 3D View- arrange the view directly inside a window in the QuickPlot
- Custom graphic or text- Drop in any sort of image file or Rich Text
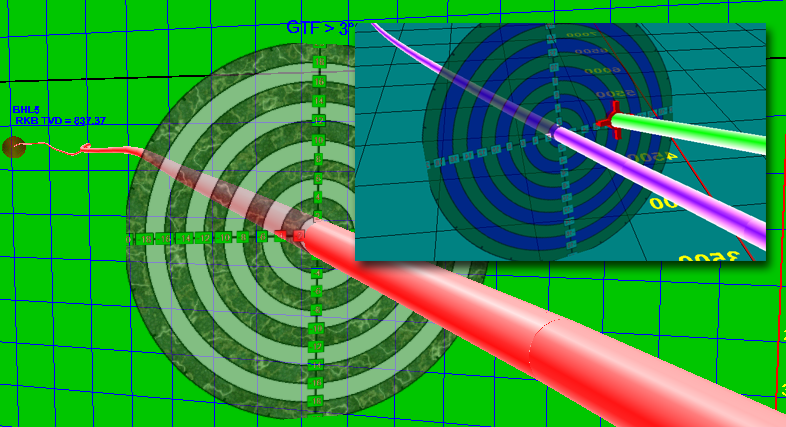
- Traveling Cylinder with optional 3D window
- Header with Job Info
- Critical Points List
- Hard Lines and Lease Lines on the Top View graph
- Lithology List
- Casing List and/or Casing indicator on curve
- Magnetics
- Geodetics
- Targets List and/or on curve
- Projections
- Ellipses of uncertainty
- North arrow
Presentation Plots
Presentation plots of extreme high quality can be generated through Hawkeye.
Lots of information and a professional appearance matter in using large plots, and Hawkeye delivers. The scaleable vector graphics behind the Presentation Plot Designer empower the user with clean, precise graphics. Utilizing a secondary program called Inkscape™ allows for infinitely deep precision and detail.
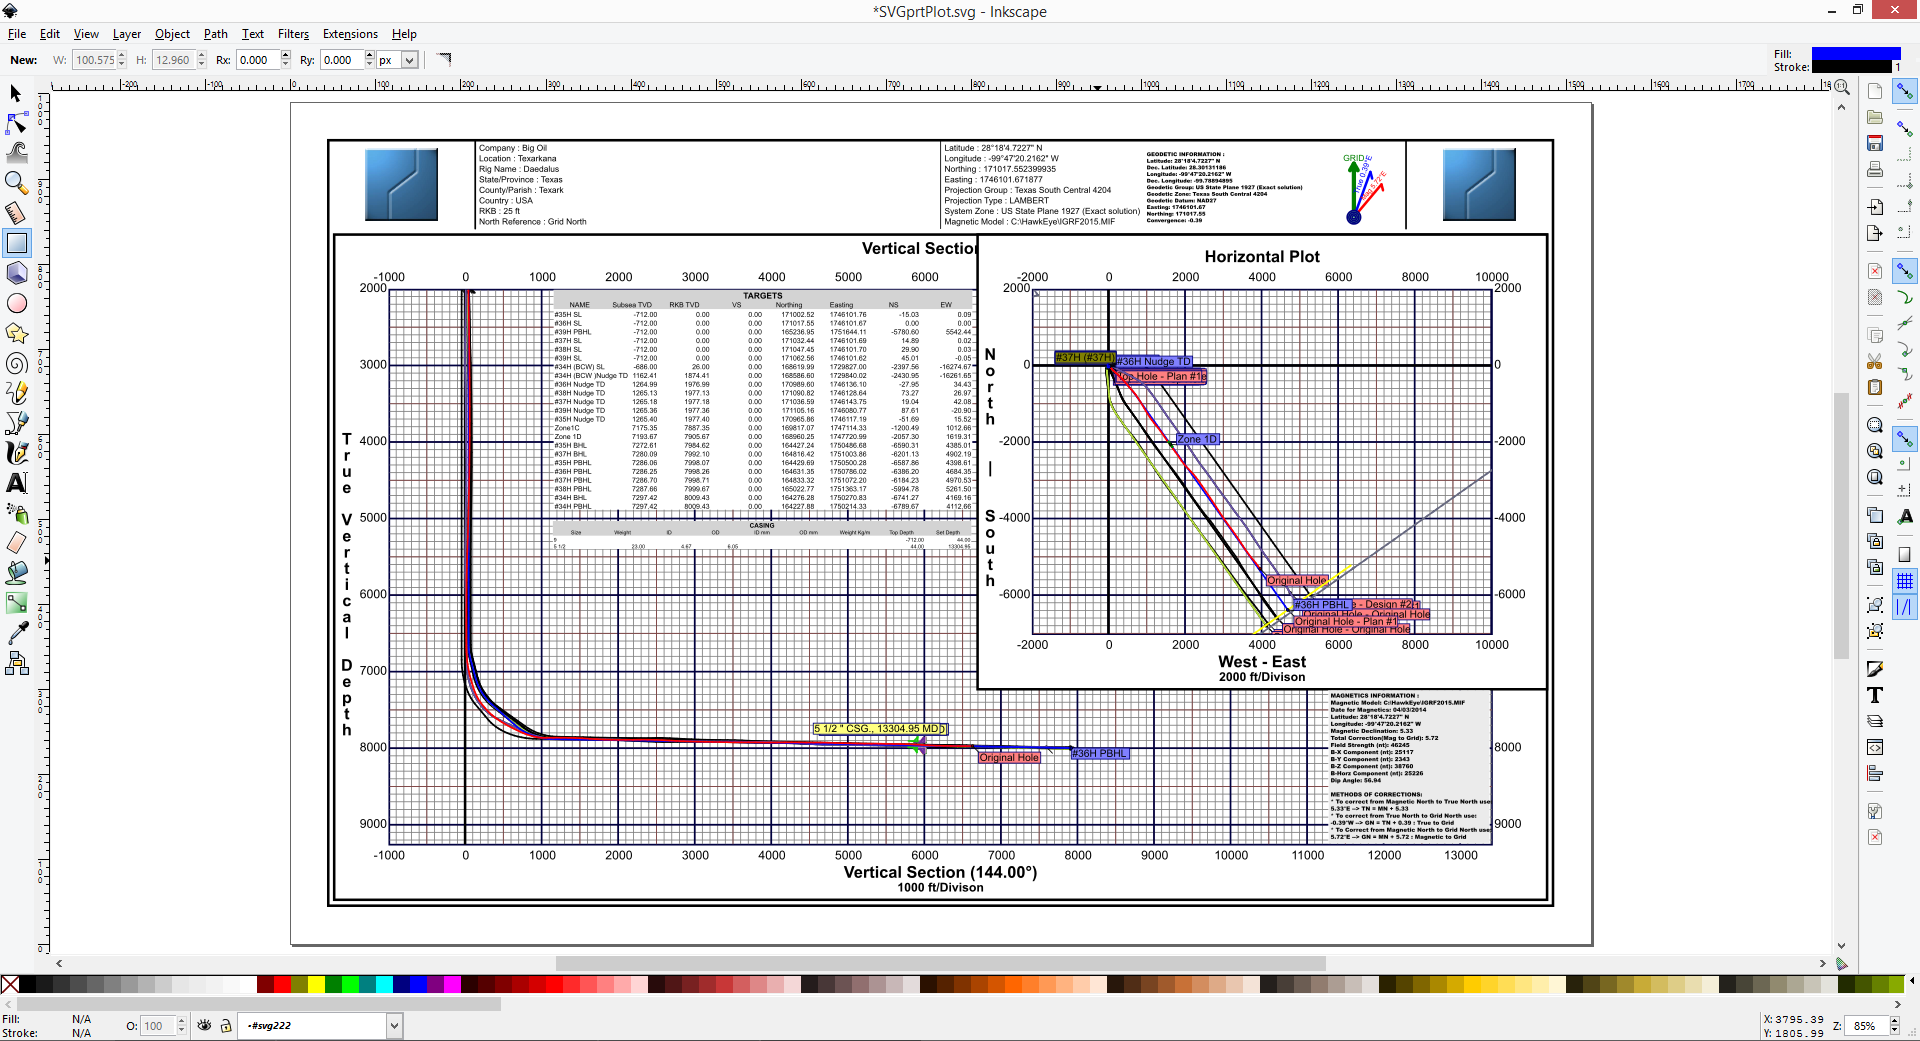
Inkscape is a scalable vector graphics (SVG) editor, which makes for very clean and precise visual representations of the native data retrieved from the project database. But SVG also allows a high degree of flexibility as far as zooming and resizing. InkScape itself a tremendously powerful SVG editor that will produce very professional and sharp professional-caliber plots.
Each project is given up to four customizable templates. The template names can be changed to whatever descriptive name the user wants. The Plot Designer allows for adding a large number of elements:
· Add Vertical- add a Vertical Section view graph to the plot
· Add Horizontal- add a Horizontal view graph to the plot
· Add MD or TVD vs ??- Add a graph which charts MD or TVD against any given parameter you chose.
· Add Graphic- Drop any sort of image file into the plot.
· Add Frame- This button encompasses a long list of additional types of frames which can be selected from the drop-down menu in the sub-panel created. Those frames include:
· Header
· Footer
· General Data
· Critical Points
· Hard Lines
· Lease Lines
· Lithology
· Casing
· Job Data
· Slot Data
· Text
· Last 3D View
· 3D Perspectives
· Geomagnetics
· Geodetics
PRINTING PLOTS: FIELD v. WELL PLANNING VERSIONS
The difference between the Field version and Well Planning version of HawkEye™ with plotting is that only in the Well Planning version will the larger wall plot sizes be available for printing and exporting. Only the smaller paper sizes are available in the Field version since it is assumed that users of the Field version will not need a plot printout larger than A3.
Exclusive Well Planning version print sizes include: A4, A2, 11x17, ISO A0-2, ISO B1, B1-B4(JIS), ARCH A-E1, Folio [8.5x13in], 22x36in, 24x48in, 24x60in, 24x72in, 24x84in, 24x96in, 24x108in, 36x42in, 36x60in, 36x72in, 36x84in, 36x96in, 36x108in and PostScript Custom.